

Format
Open the needed module in a separate tab and get the full explanation right away instead of a short card paragraph
 Lavka Lab
Details
Lavka Lab
Details
Detailed descriptions
A multi-timeframe map of FVGs, FVAs, and overlapping swing levels with English and Russian language support.
IRL Map
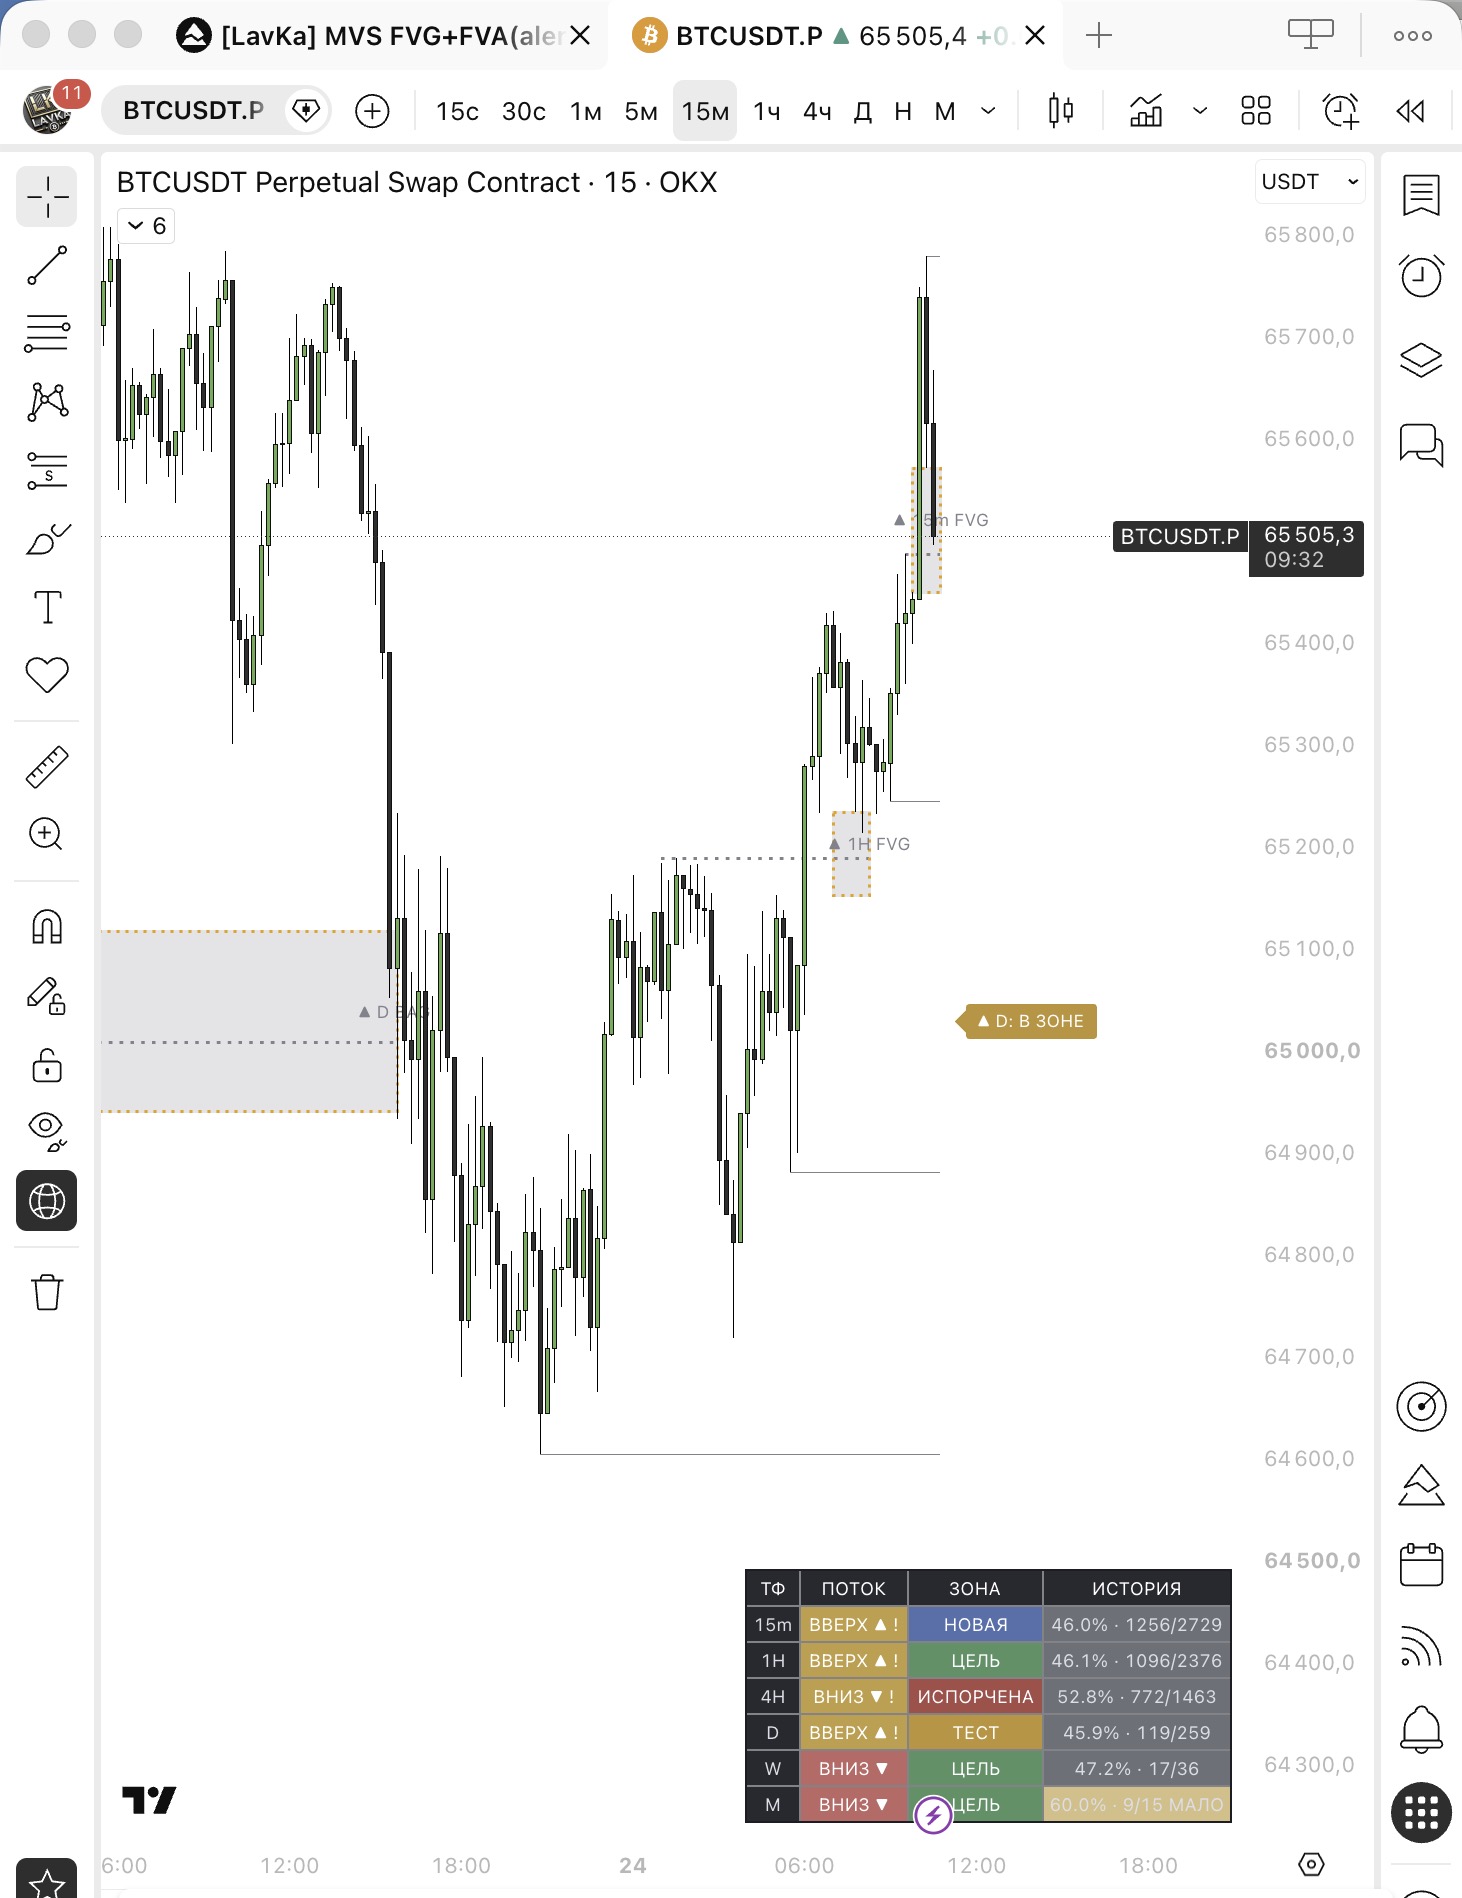
IRL Map helps you read the market as a connected scenario. It finds FVG and Breakaway Gap zones, links them with external ERL liquidity, and tracks what happens after price returns into the area.
Screenshots


What it shows
Zone lifecycle
After the first return into the zone, the reaction stays active until ERL is reached or invalidation is confirmed.
FVG + FVA
LavKa MVS FVG+FVA shows not only where a Fair Value Gap exists, but also which fresh swing high or swing low is structurally connected to that imbalance. This gives you both the gap itself and the working FVA boundary tied to the move.
Screenshots


Core capabilities
Settings
Order Block
[LavKa] MVS OB+HTF v2 detects bullish and bearish Order Blocks on the current chart timeframe together with the closest higher timeframes. Zones are confirmed through displacement and, if needed, through directional FVG logic so the chart stays focused on structurally meaningful areas.
Screenshots


Key features
Confirmation flow
Zone states
Settings and use
The module supports colors, transparency, labels, zone history, and alerts for new blocks, first tests, and invalidations. It can be configured in both English and Russian, including both the settings and the on-chart indicator data.
HTF v2
[LavKa] MVS HTF v2 shows completed higher-timeframe candles, the currently forming HTF candle, active liquidity boundaries, and calendar structure without forcing you to switch between multiple intervals. It keeps higher-timeframe context visible on the chart where execution happens.
Screenshots


What it shows
Automatic mapping
Active boundaries
Calendar, alerts, and language
The module includes an intraday calendar grid, alerts for HTF candle closes and liquidity sweeps, and built-in English and Russian chart language.
Custom strategy
If the existing modules do not match your system, we can build a custom indicator or strategy, as long as the logic can be formalized and verified inside TradingView.
What can be built
Workflow
Important
All Lavka Lab modules are analytical tools. They help structure context and speed up analysis, but they do not guarantee outcomes and do not replace risk management.